
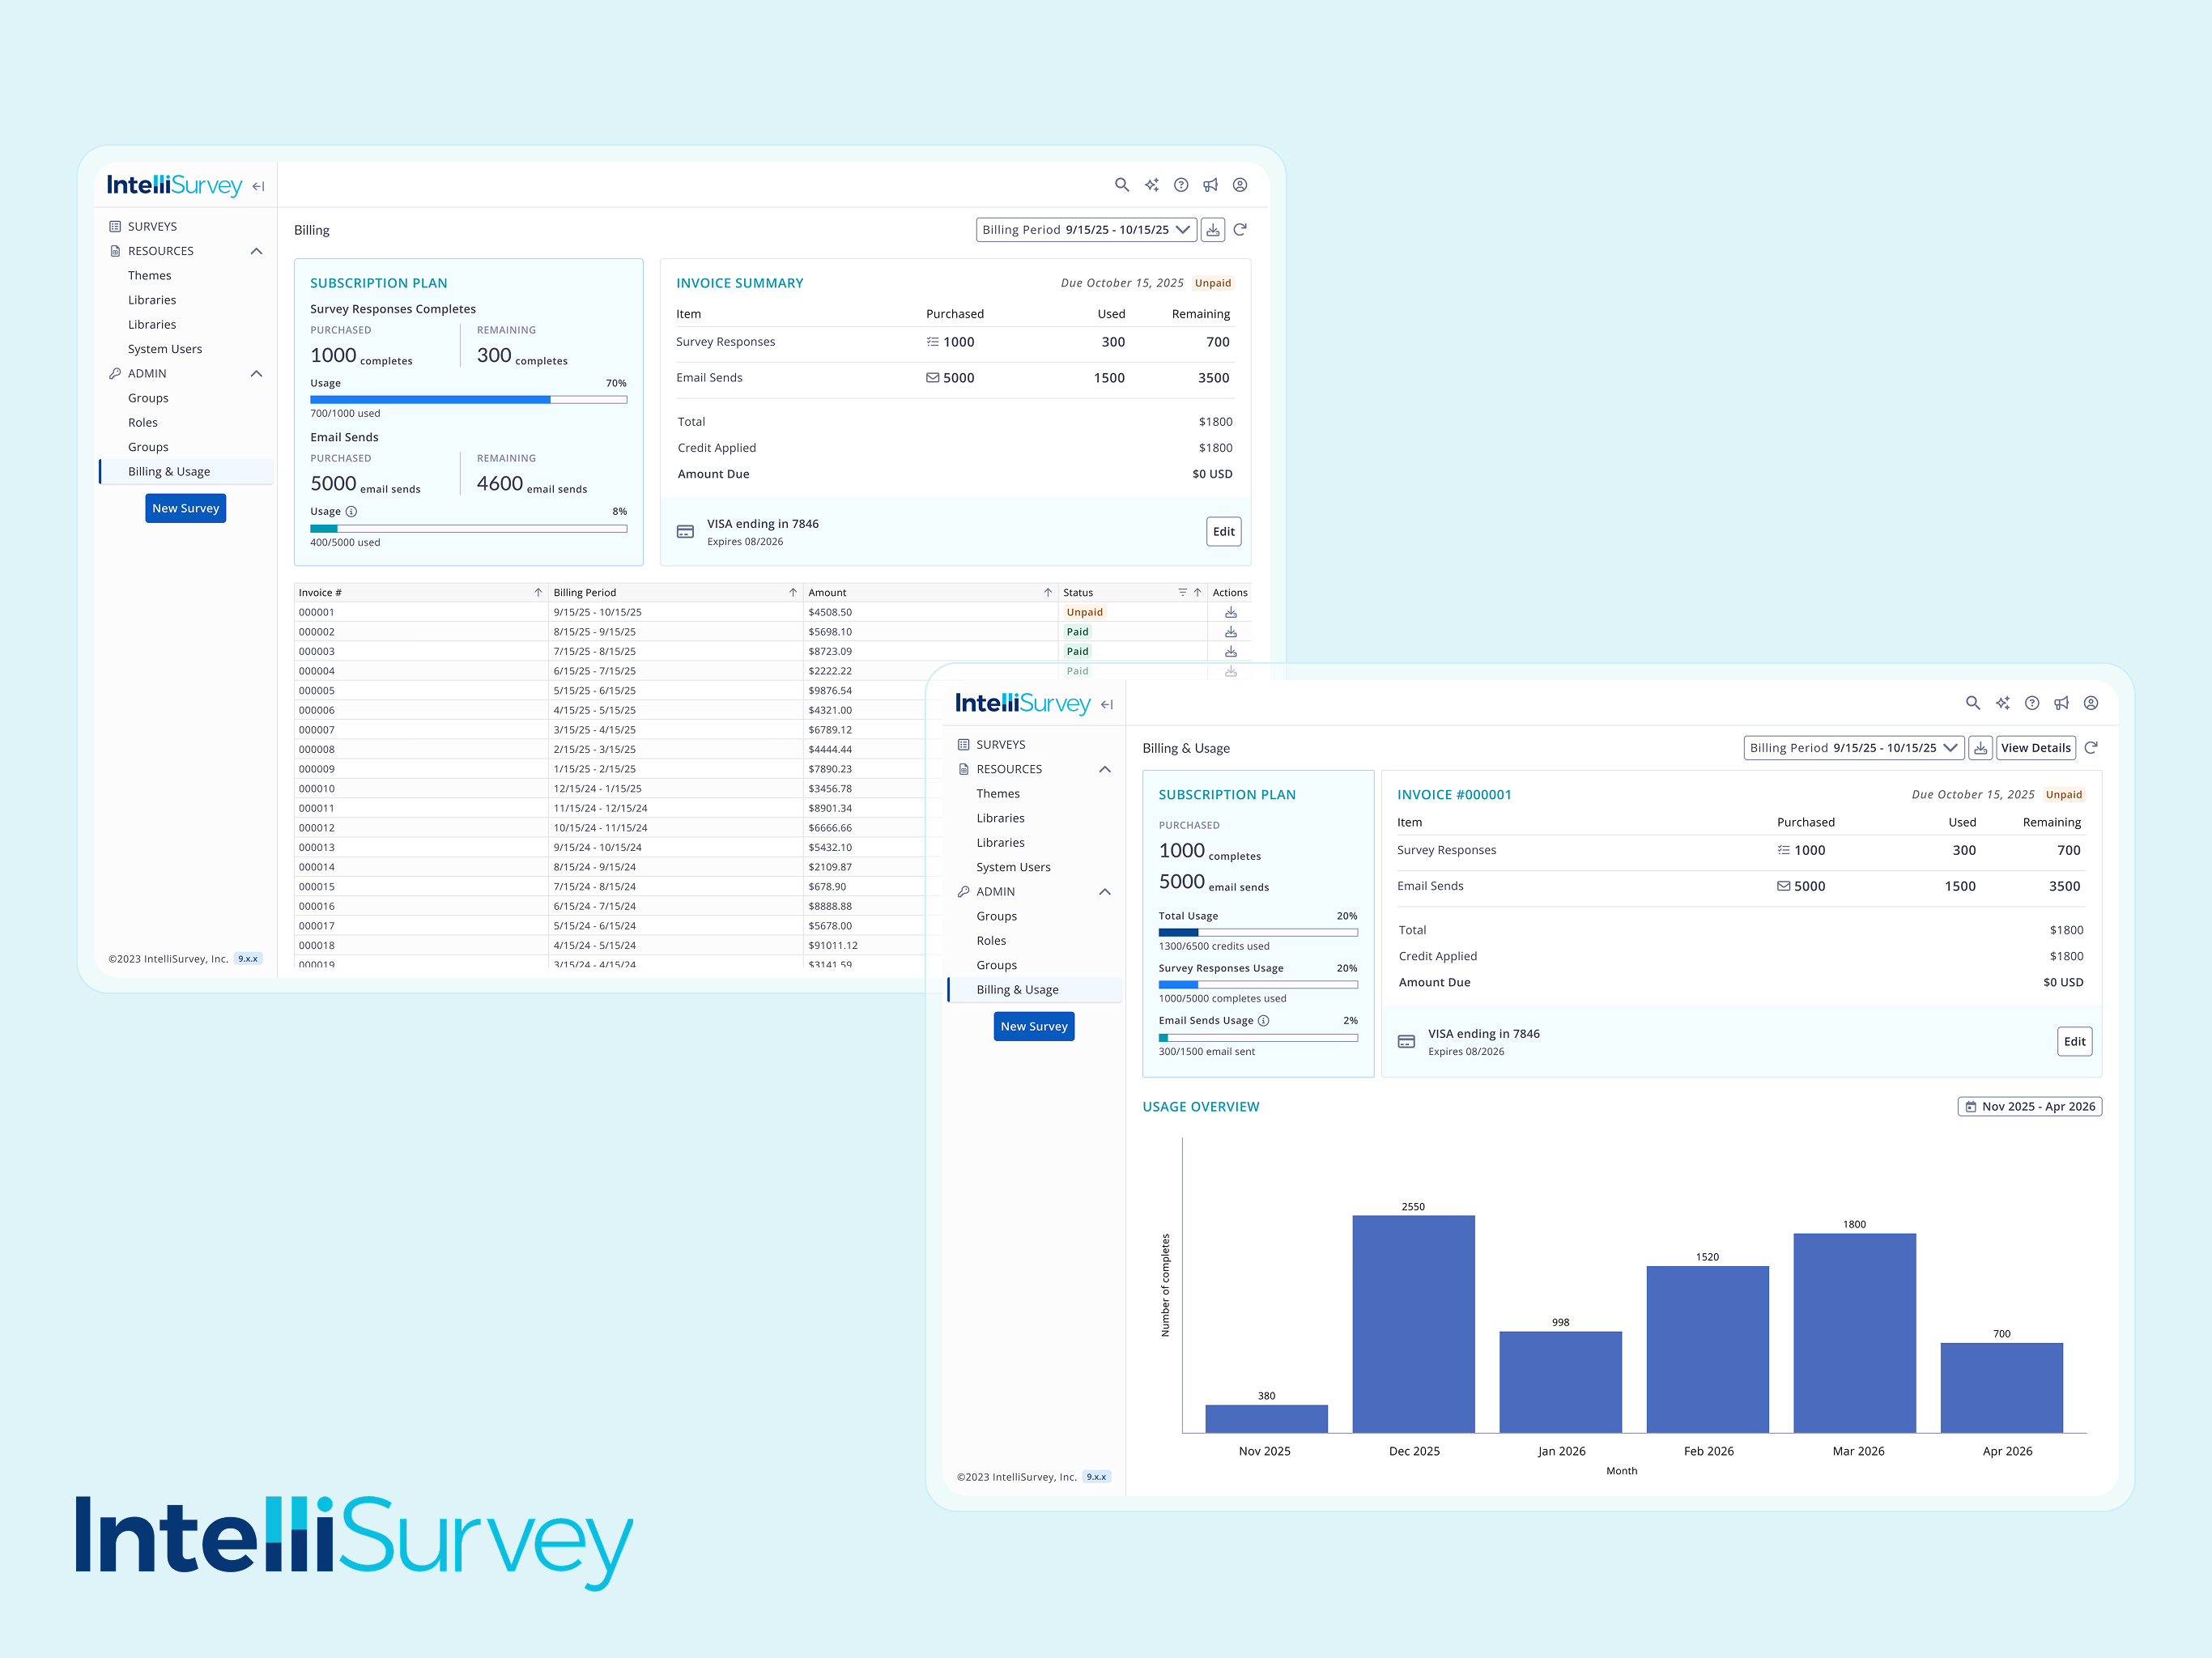
01 Billing / Usage Dashboard for SaaS
Owned a SaaS usage dashboard from v1 to v2, automating the billing process from hours to near-instant and establishing a scalable UX pattern for future features.
Product Designer
Nov - Dec 2025
May - July 2026
1 Product Designer,
2 Product Managers,
2 Engineers
Product thinking,
Prototyping
CONTEXT
Building a usage dashboard the business needed today, ready as a system that holds tomorrow.
I juggled seemingly contradicting needs: delivered what the client side needed now (a precise, clean-looking billing interface) and built it as a pattern that can be scaled for future incoming data.Here is how I did it without having to pick one between shipping and lasting.
THE CHALLENGE
Ambiguity: Nobody knew exactly what to show
The JOURNEY
The Initial Read: need for a one glance at what's due and why
I committed to it, designed, and shipped it. It was the right bet for the picture we had, and shipping it is what brought the real picture into focus.
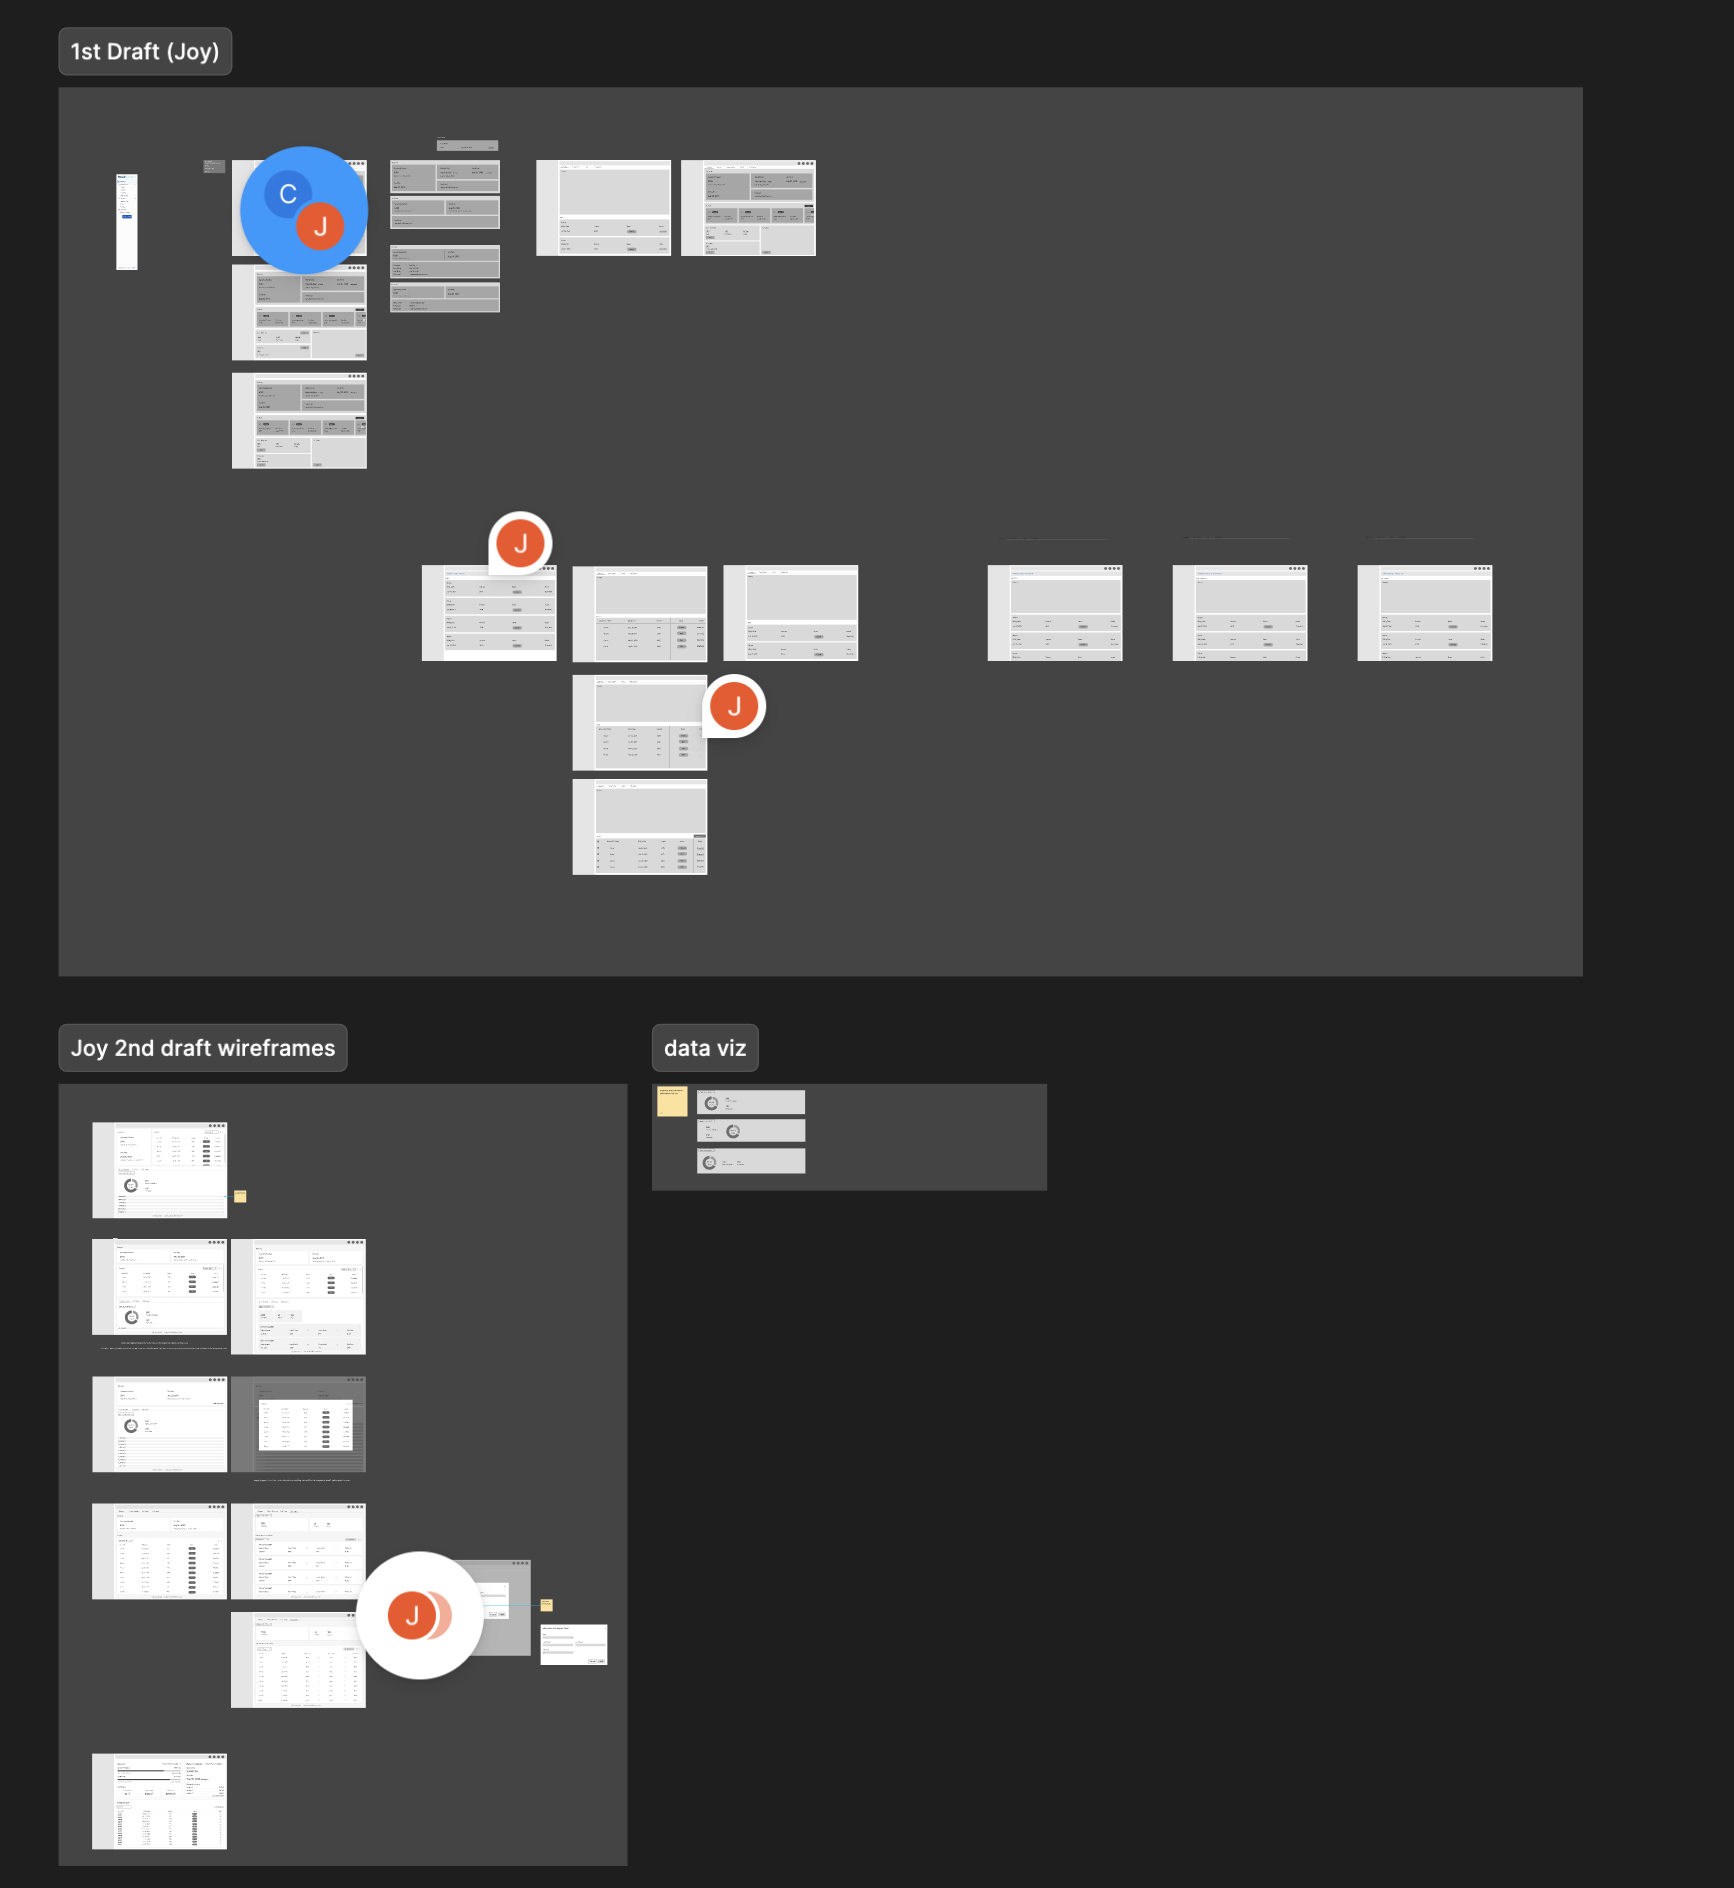
THE JOURNEY
A stakeholder call changed the priority overnight
The business model wasn't locked yet, so billing precision was premature.
What we did know: two plan models were coming, pay-as-you-go and subscription.
And billing touches real money. Get it wrong, then it's not a design fix but a customer trust issue.
On the other hand, usage didn't carry that risk.
I stopped designing one all-in-one dashboard,
and started designing for a different problem serving two different audiences:
‘How might we surface the most relevant information tailored to different audience’s need?’
The JOURNEY
I first made changes to the information architecture
I split billing and usage into separate destinations. v1 had crammed invoice math and a raw usage table onto one page. With that change in IA, usage now had room to actually lead, and billing wasn't pretending to have answers it didn't have yet.
Therefore, their hero became a usage bar — purchased, used, remaining, laid out at a glance — plus a renewal date card, so they're never caught off guard by a billing cycle they didn't see coming.
Same underlying data. Two different heroes.

